Background
A man in his mid-50s is concerned about his current approach to investing. His current portfolio is built around several stock positions currently weighted towards technology. This is a logical choice because he is a senior executive in the software industry. As he considers the idea of retiring, he becomes concerned about his current methodology and whether it will serve him well in the future.
He is active and working and wonders whether he can dedicate the time necessary to manage his own funds. He goes to a major investment firm to discuss transitioning to a managed account alleviating him of the responsibility of stock picking and thus freeing up his time to pursue his hobbies and continue to be productive at work.
For this case study, the firm offered a complex strategy of 17 different positions for an annual fee of 1.3% (outrageous). The positions ranged from US stocks to international stocks, momentum funds, volatility funds, and so much more. Needless to say, this entire allocation can be simplified.
This case study is going to focus on four areas. They are Portfolio Simplicity and Risk Attribution, Portfolio Drawdowns, Common Portfolio Metrics, and High Fees. If you wish to skip around the case study, a brief answer will be provided to each area below:
Four Areas
Portfolio Simplicity and Risk Attribution
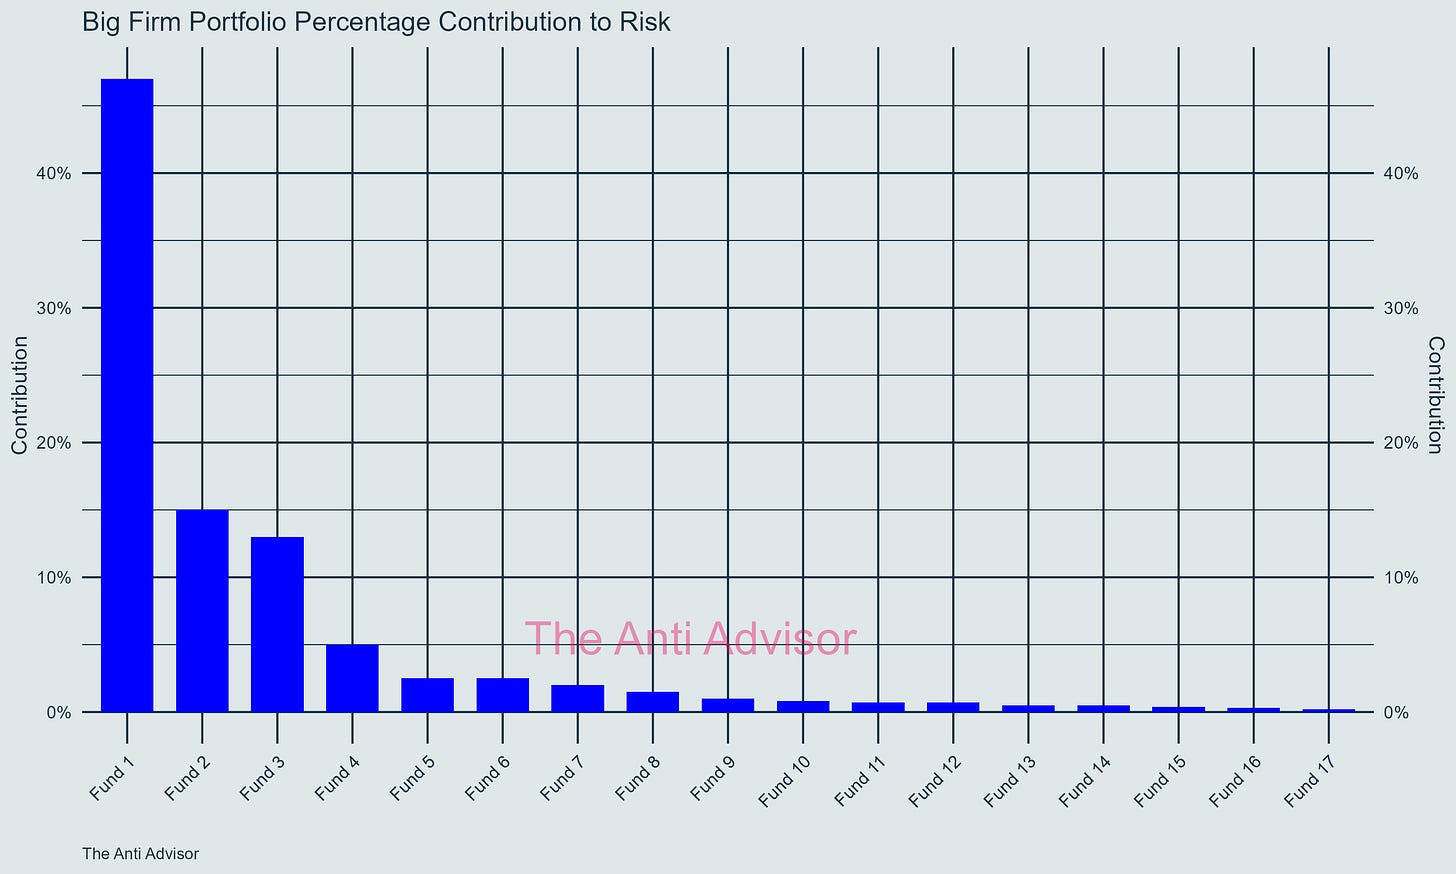
📊 17 assets is an over abundance of positions for this portfolio. 80% of the returns and the risk come from the top 4 positions. The other twelve provide almost no value to the portfolio and seemingly there just to make it look diverse.
Portfolio Drawdowns
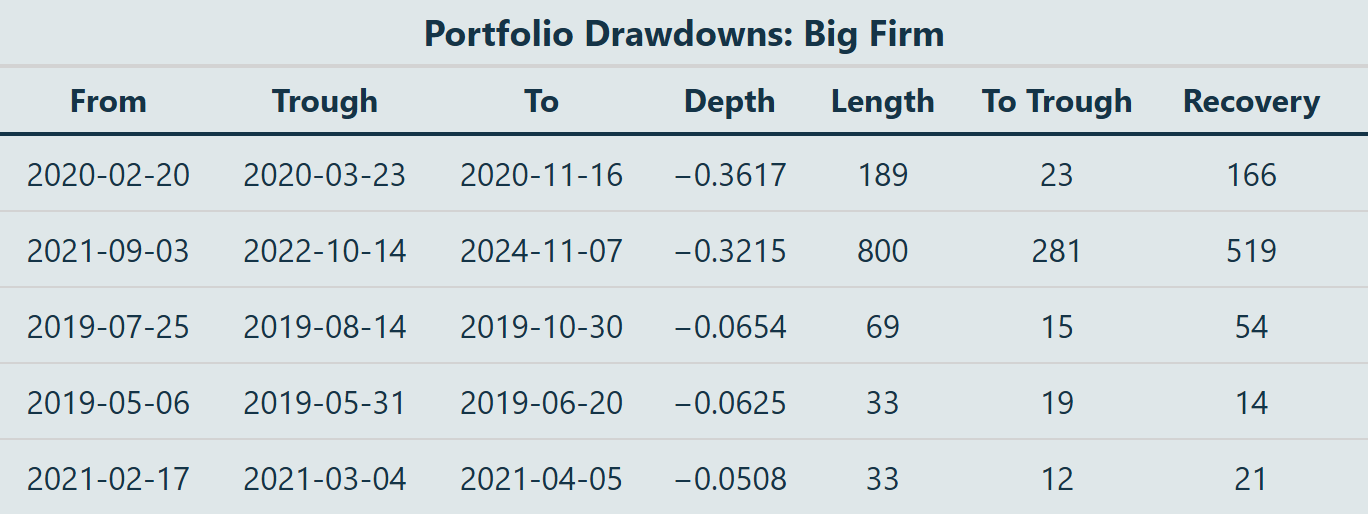
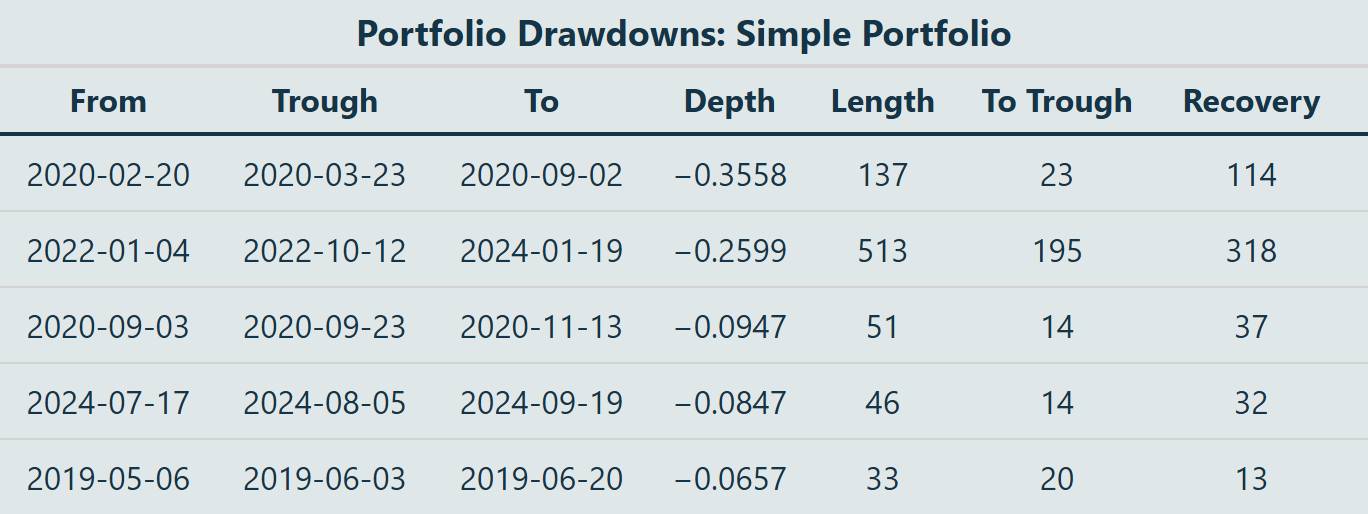
📉 The drawdown metrics were similar in the 2020 crash. Each portfolio saw a drawdown of around 35-36%. The extra diversification of the 17 asset portfolio provided no benefit in this market crash scenario. In fact, in 2022 when markets fell, the 17 asset portfolio took almost 300 days longer to recover after falling over 7% further. This was only because of its exposure to international but still an interesting point.
Common Portfolio Metrics
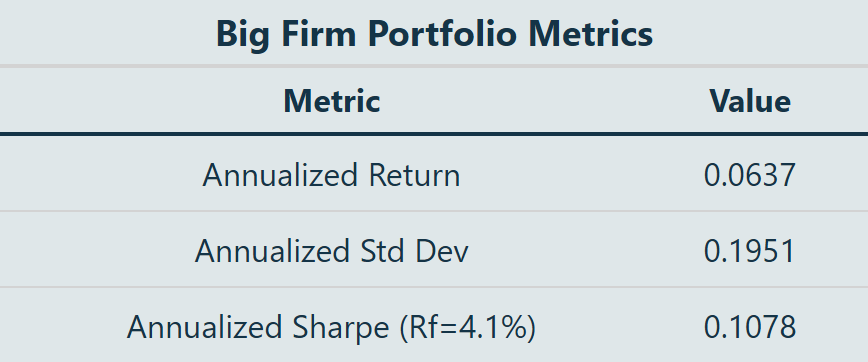
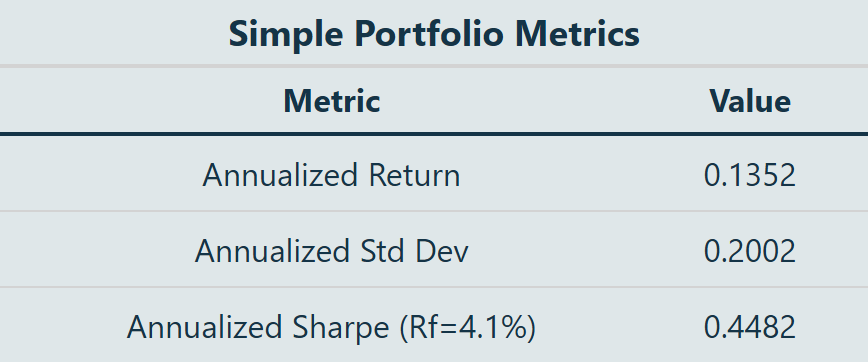
🧮 The most common metrics are annualized returns, on average how much the portfolio returned during a given time frame, and the annualized standard deviation, the risk inherent in the portfolio. The 17 asset portfolio returned 6.37% from March 2019 to November 2024 with a risk of 19.51%. The simple portfolio returned 13.52% with a risk of 20.02%. Simple outperformed here with the same risk taken.
High Fees
💵 This is the worst part. The big firm was planning on not only charging 1.3% per year but 15 out of the 17 funds were their own products. Essentially the company was double dipping. The simple portfolio would only be paying the expense ratio on the ETFs.
1. Portfolio Simplicity and Risk Attribution
After a series of discussions, the firm put together a portfolio of assets investment for his individual retirement account (IRA). The plan consists of
● Close to 100% equities allocation to mirror his current allocation of tech
● 17 funds:
Most are open ended proprietary mutual funds
A few ETFs.
The funds are the firm’s own mutual fund
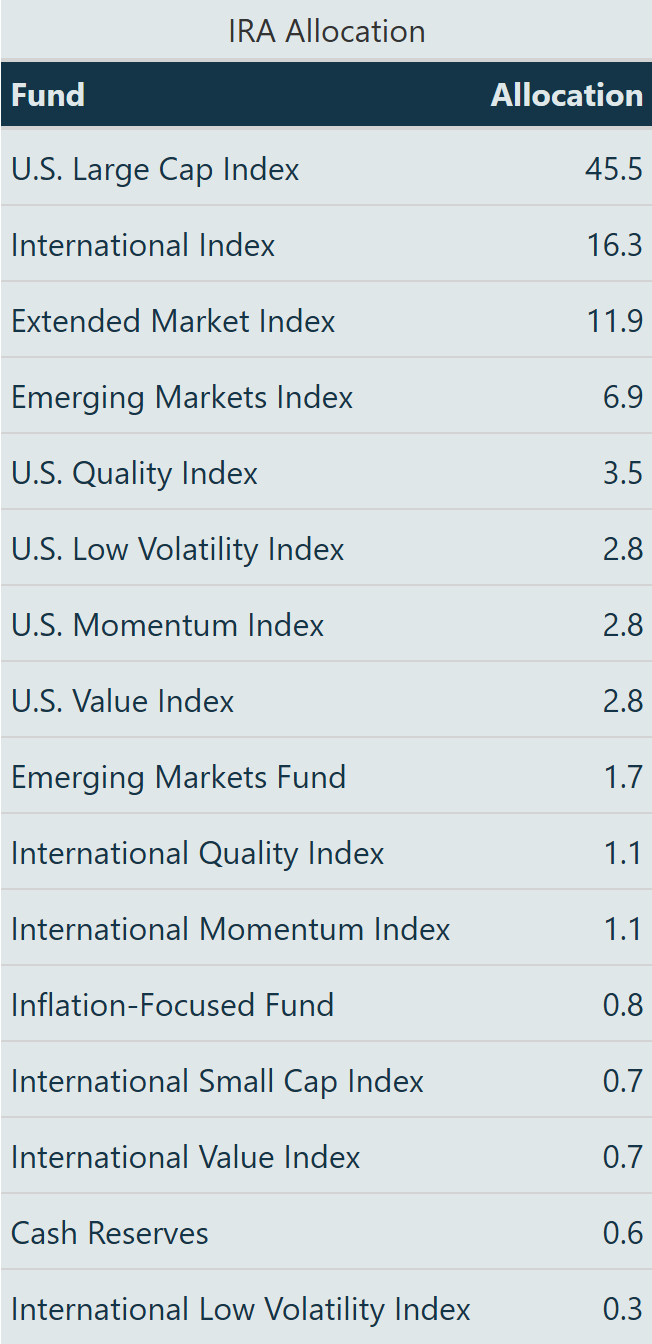
● Below is the actual allocation given to him:
Note: Percentages do not add up to 100% because of rounding error.
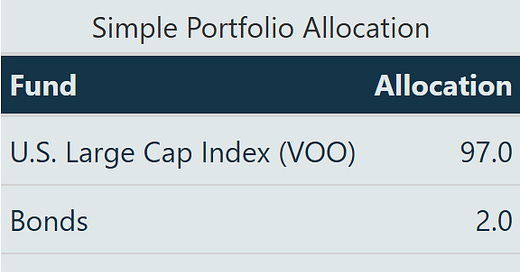
A better approach is to remove the complexity and focus on simplicity. Here is our take on this portfolio. This portfolio captures the essence of the 17 position one with 3 positions and still maintains the same equity exposure.
Here is the breakdown of the difference between the two. First, in the 17-asset portfolio, we notice that many of the funds are highly correlated, which does little to nothing to diversify the portfolio when markets crash. Second, 13 of the positions are under 5% of the portfolio value. The added return contribution from each asset is minimal but adds to the risk. This just adds complexity where it is not needed. Third, it does provide the illusion of diversification and is an easy way to justify the management fee.
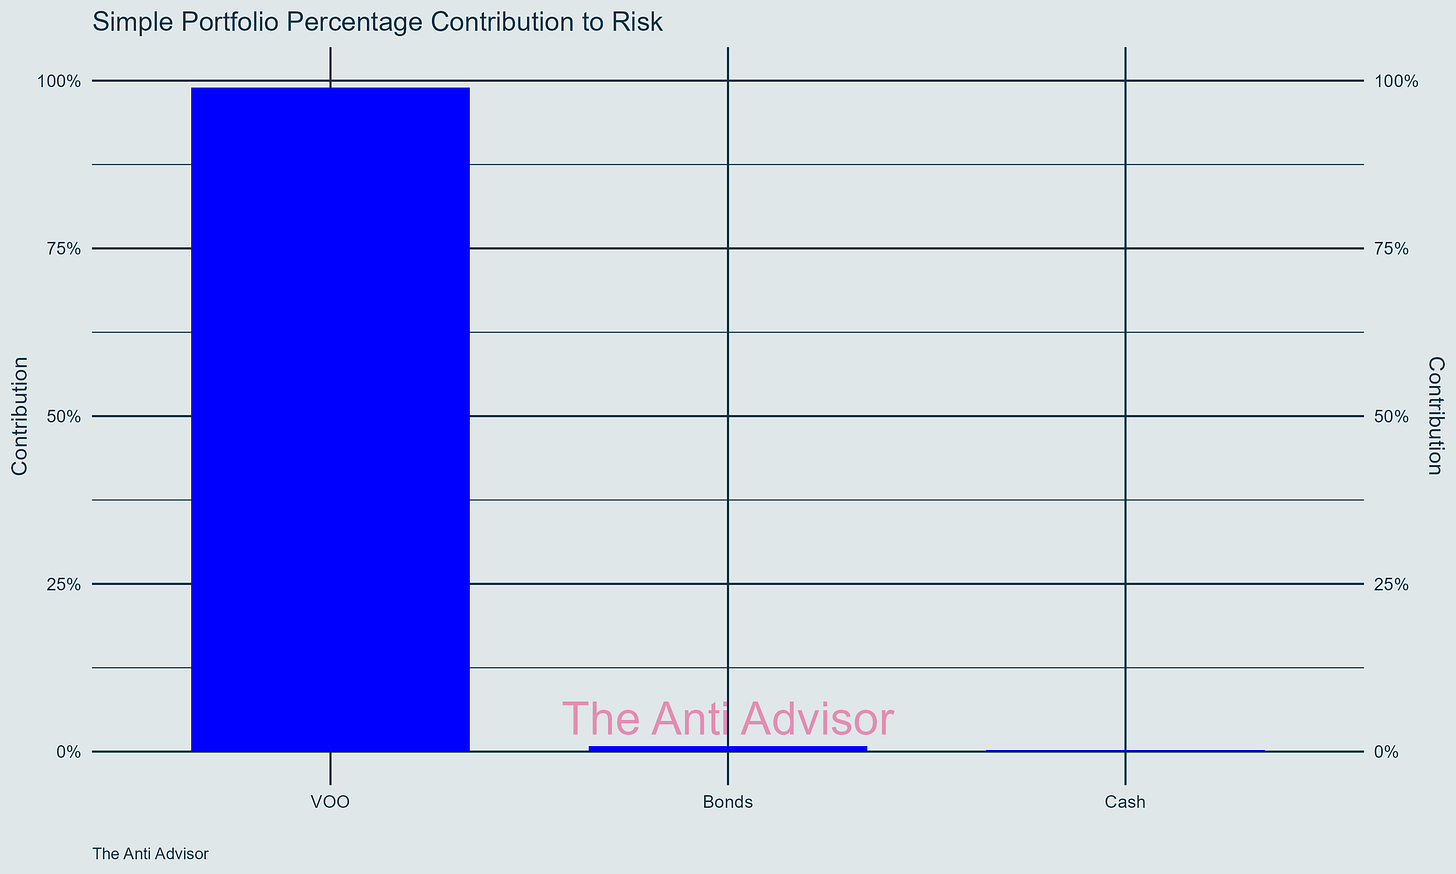
Below is the visual comparison of the percentage contribution to risk of each asset in each portfolio. For the big firm, 80% of the risk comes from the top 4 positions. The majority of the simple portfolio’s risk comes from the US Large Cap Index (VOO) at about 97%. Mind you that the VOO represents 500 stocks in the S&P 500 and has some diversification characteristics built in.
Big Firm’s Portfolio Attributes
Simple Portfolio Attributes
2. Portfolio Drawdowns
The tables below show key drawdowns and time to recover for both the Big Firm and the Simple Portfolio.
A quick explanation.
From: The date top of the market before the decline.
Trough: The date of the bottom of the market.
To: The date when the portfolio got back to even from the From date.
Depth: Portfolio loss (Ex: -0.3617. The portfolio lost -37.17% of its value)
Length: How many trading days (252 in a year) total from Peak to Recovery.
To Trough: How many days it took for the portfolio to bottom.
Recovery: Days from Trough to Recovery
For the Big Firm portfolio, the September 3, 2021 drawdown took 800 trading days in total from the peak to recovery. It got back to even on November 7, 2024. It took over three years in order to recover, even though 2023 and 2024 were great years for the overall market. The exposure to international equities is what was dragging on it.
For the simple portfolio table, the January 4, 2022 drawdown took 523 days to recover. It got back to even on January 19, 2024. Still quite a bit of time to recover but about a year faster. The two portfolios did have something in common however. That is their 2020 depth numbers. Each portfolio loss was around -35-36%, suggesting that the extra diversification plays little to no part in helping during extreme events.
3. Common Portfolio Metrics
This section will focus on three common portfolio metrics that are used to compare risk and return attributes between portfolios.
Annualized Return: How much percentage made per year on average
Annualized Std Dev (Risk): Price swings of the portfolio up and down
Sharpe Ratio: How much extra return you're getting taking on extra risk. It is a ratio of the above two measurements.
Risk Free Rate: The rate of return of a risk-free asset (Treasury Bill, T-Bill, short term government debt). In this case the T-Bill rate is 4.1% shown in the table as Rf=4.1%
The table below shows the annualized return of the Big Firm Portfolio is 6.37% with 19.51% volatility from March 2019 to November 2024. The Sharpe ratio was 10.78. After adjusting for the T-bill rate, the firm’s portfolio gained just over 2% annually above the risk free (4.1%).
The table below shows the annualized return for the Simple Portfolio is 13.50% with 20.03% volatility from March 2019 to November 2024. The Sharpe ratio was 44.82. The annual return was about 9.5% above the risk-free rate. This is four times better in both metrics, returns minus the risk-free rate and the Sharpe ratio, than the Big Firm portfolio.
4. High Fees
The annual fee of 1.3% is quite high even in the registered investment advisor (RIA) space. This fee means the portfolio now needs to beat inflation, taxes, and now the fee. This sort of pigeon-holes the portfolio into being more aggressive than what it actually needs to be in order to keep up with inflation or even maintain real growth. Then to top it off, the allocation invested heavily into their own mutual funds.
To be fair, they did do a financial plan. However, outsourcing a financial planner for a few hundred dollars an hour and then managing the investments independently can be done too.
Conclusion
There are many ways to construct a portfolio. The preference here is simple over complex and it is important to deconstruct the characteristics before making any final determinations. Not many would want a single asset portfolio, but it is important to realize complex solutions are not always valuable and only obfuscate what a portfolio might be getting.

