This case study demonstrates the ability of some investment advisors who offer portfolios that look to be allocated in way to show diversification. For some credit, they offer a simple approach using only 5 mutual funds but as we break it down, we see that the strategy can be simplified even further.
Back Story
This involves a woman who needed help with her new investment retirement account (IRA) that she received later in life. She wanted to have a growth style account while also generating current income.
The financial advisor offered a relatively low-cost management fee for taking on her portfolio. This was because he would choose the investments, in this case mutual funds, and then charge a quarterly “fee” of about $100.
Unfortunately, with mutual funds, financial advisors can receive a front end load fee by investing in these mutual funds for the client. The woman here was getting charged the quarterly fee and the financial advisor could have been making commission off buying the 5 mutual funds in her account every year.
Let’s see how this all breaks down by inspecting the mutual fund strategy and what could be a simpler and more effective option while also saving the quarterly fee.
Financial Advisor’s Strategy and a Simple Solution
Here is where the fun begins.
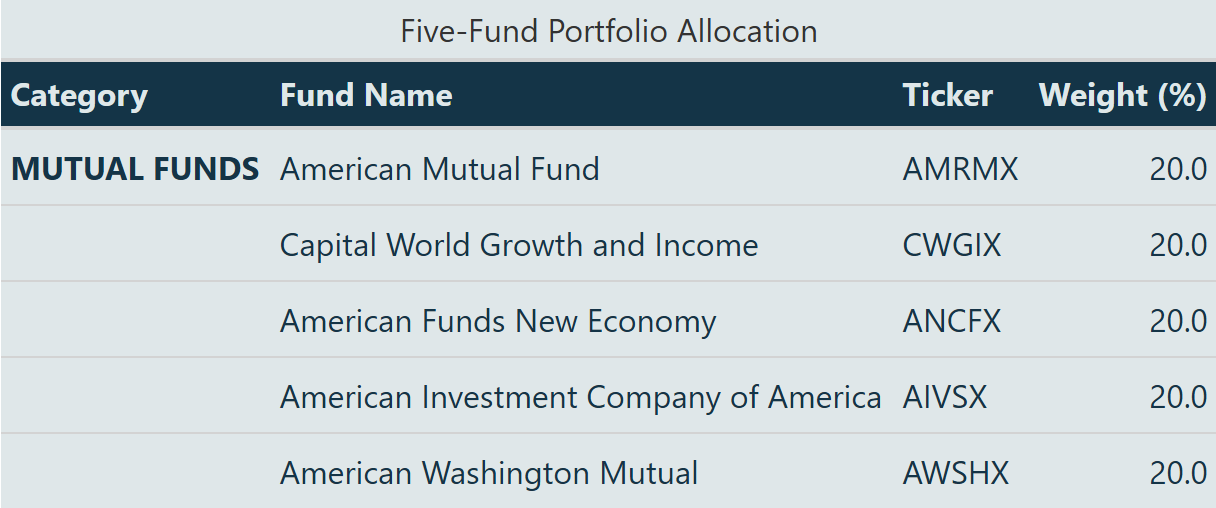
The financial advisor recommended an equal-weighted, 20% of each, 5 mutual fund portfolio of these five funds.
Notice anything similar about them?
All these are American Funds’ products, generally focusing on large, established companies with an emphasis on value investing and dividends, except for Capital World Growth. Capital World Growth includes international equities, as the name implies.
Here is a simpler solution:
I know what you are saying. How can five funds be equal to one fund? I am about to prove this to you with facts, math, and integrity.
Correlation Analysis
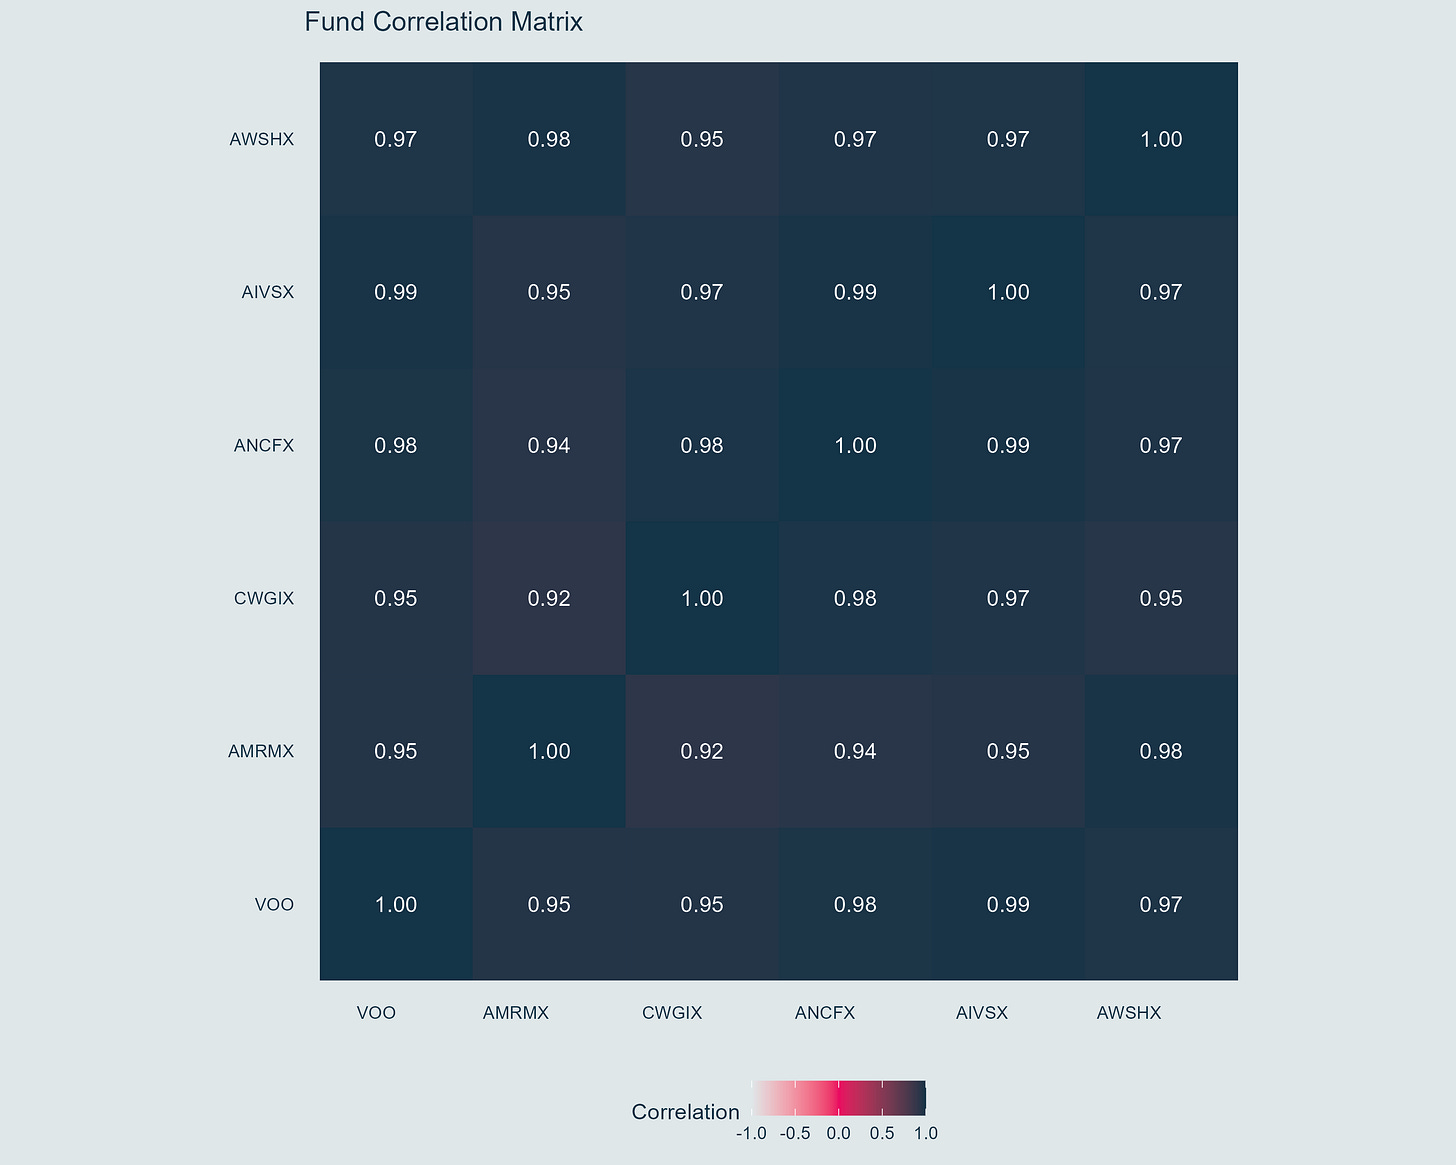
The correlation matrix reveals a crucial insight about diversification:
All five mutual funds show extremely high correlation (0.92-0.99) with each other
High correlation with VOO (0.95-0.99) indicates redundant exposure
CWGIX's international exposure provides minimal diversification benefit
This high correlation means the advisor's strategy creates an illusion of diversification while essentially tracking the same underlying market movements.
Portfolio Risk Metrics on $100,000 Account
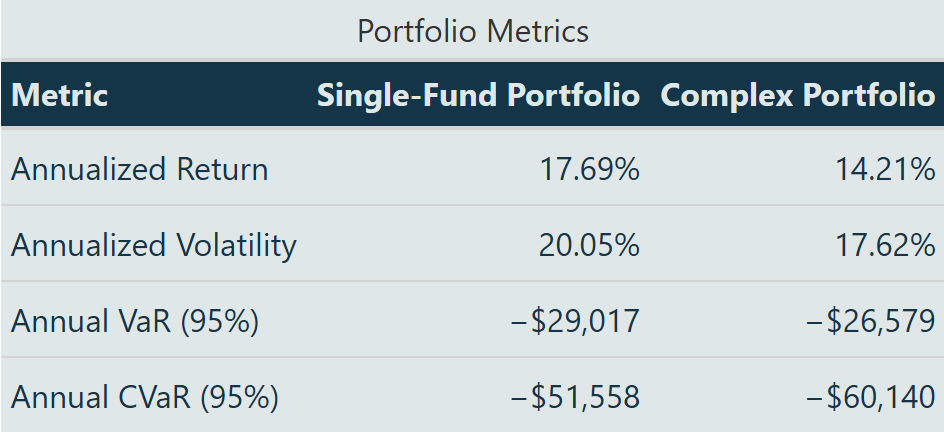
The metrics tell a story about the single-fund approach:
Higher annualized return (17.69% vs 14.21%)
Comparable volatility (20.05% vs 17.62%)
Better risk-adjusted returns
Lower tail risk (CVaR: -$51,557 vs -$60,140)
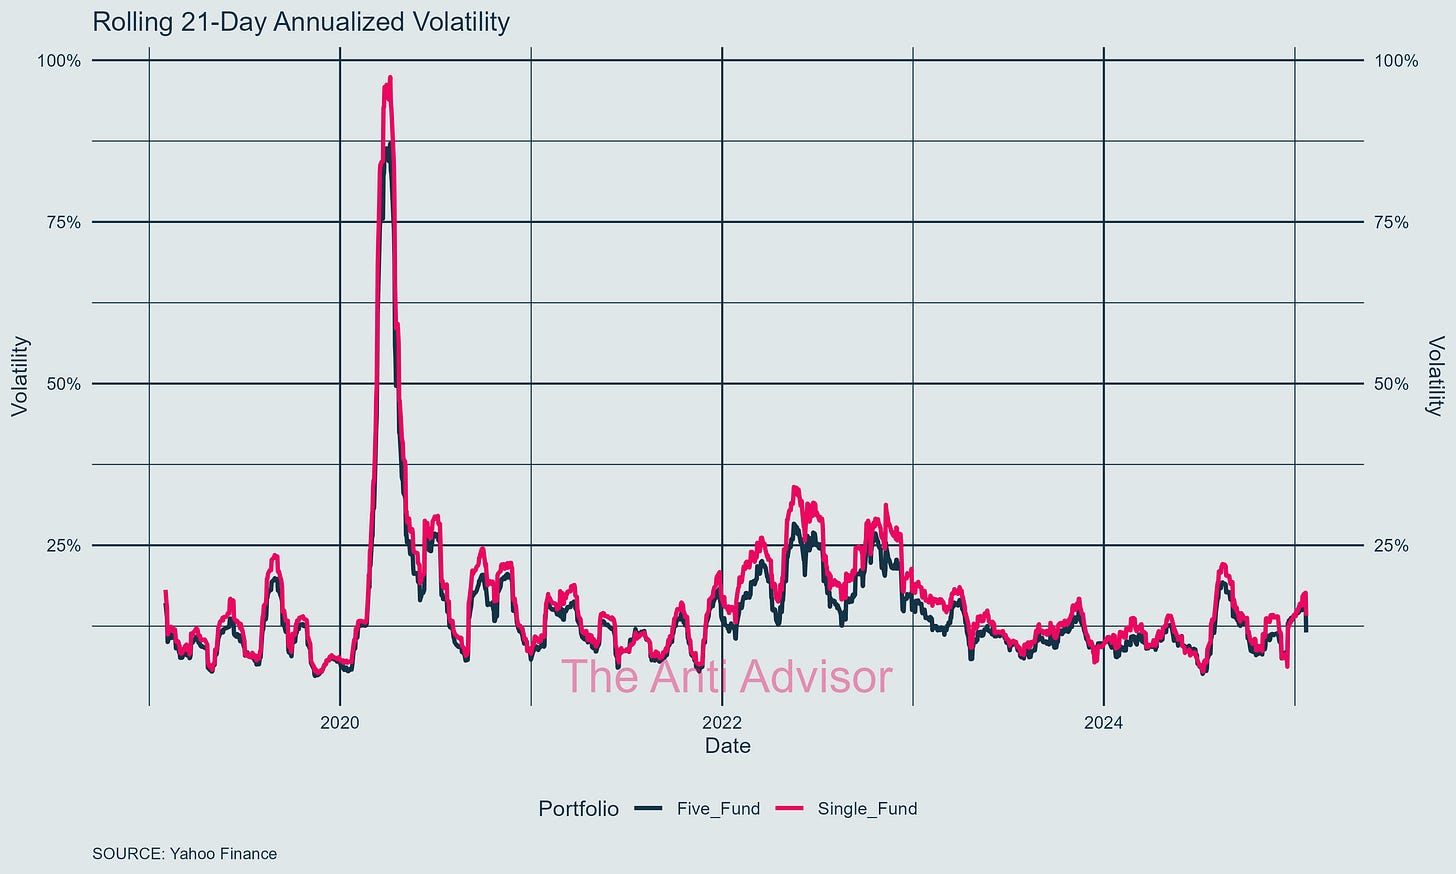
Below is the volatility of each fund over time so you can see the visual of how closely related they are!
Cost Analysis
The complex portfolio incurs multiple layers of costs:
Quarterly advisory fee ($100)
Sales loads on mutual funds
Higher expense ratios compared to VOO
VOO: 0.03%
AMRMX: 0.58%
CWGIX: 0.75%
ANCFX: 0.60%
AIVSX: 0.58%
AWSHX: 0.57%
Hidden transaction costs from fund turnover
These costs compound over time, contributing to the performance gap between the portfolios.
Portfolio Return Analysis
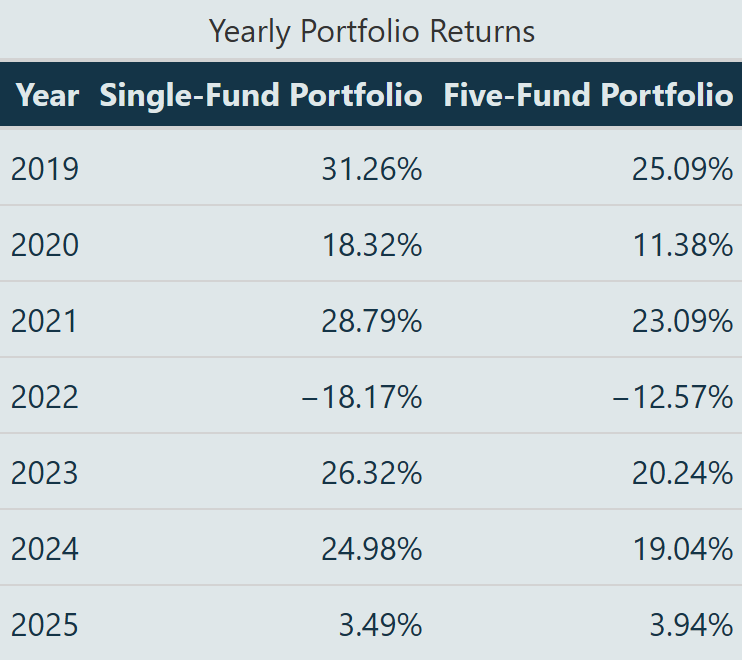
2025 yearly return as of January 23, 2025
The return data shows clear outperformance of the single-fund approach over the five fund portfolio:
Higher yearly returns in 5 out of 7 years from 2019-2025
Significant outperformance in volatile years (31.26% vs 25.09% in 2019)
To be fair it has worse downside protection in 2022 (-18.17% vs -12.57%)
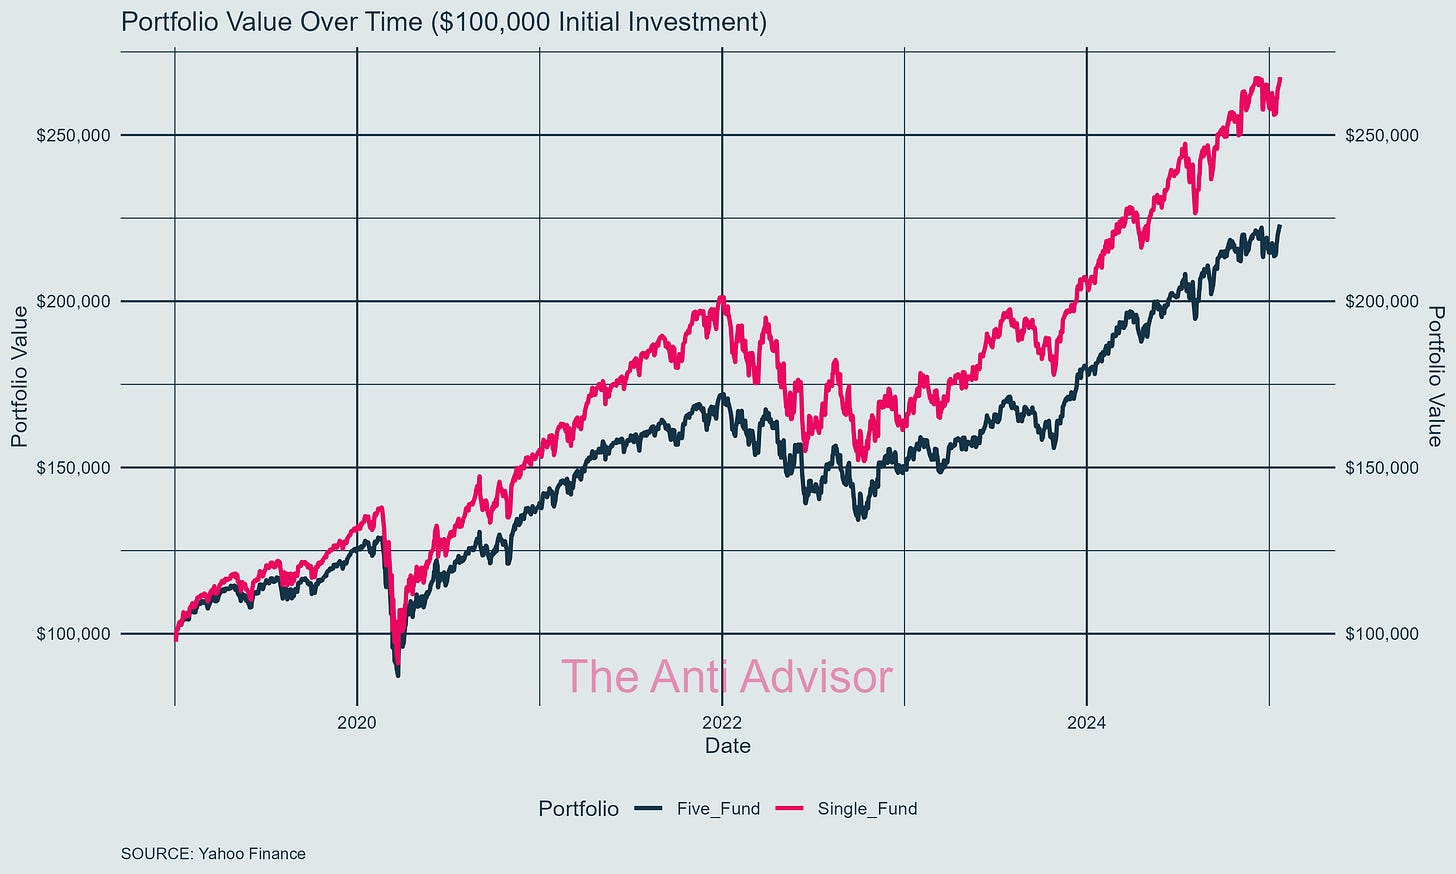
The cumulative effect of this outperformance is visible in the portfolio value chart, where $100,000 invested in the single-fund portfolio consistently maintains a higher value than the complex approach.
Behavioral Benefits
A single-fund approach offers clear advantages:
Transparent cost and fee structure
Simplified performance monitoring
Reduced emotional trading triggers
Lower cognitive burden
Conclusion
The analysis reveals the striking inefficiency of the advisor's five-fund strategy, which essentially creates an expensive illusion of diversification. With correlation coefficients between 0.92-0.99, this portfolio moves virtually in lockstep with each other and the broader market.
This redundant exposure comes at a steep cost:
Investors bear the burden of quarterly advisory fees
Sales loads
Higher expense ratios ranging from 0.57% to 0.75% - far exceeding VOO's 0.03%
Even the supposed international diversification through Capital World Growth provides minimal benefit. The performance data further exposes this facade, with the complex strategy consistently underperforming while generating additional costs and cognitive burden for investors.
This case exemplifies how a seemingly diversified approach can mask underlying inefficiencies and unnecessary expenses.


